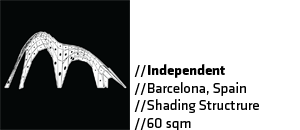
Shading Shell is a catenary roof breded from the optimal area of sun exposure.
The foot print for this optimal area is generated in a preliminary sun exposure site analysis.
These values are then translated into rhino and generate the surface to be relaxed.
The geometry, once relaxed, is also analysed according to it's sun exposure and it's values are reintroduced through rhinoscript to generate the circular openings in each panel (varying size according to it's exposure).
//more text at the end of the page//
THERMAL PERFORMANCE
- - - - - - - - - - - - - - - - - - - - - - - - - - - - - - - - - - - - - - - - - - - - - - - - - - - - - - - - - - - - - - - - - - - - - -
ECOTECTtoEXCELtoRHINOSCRIPT
//text cont.//
The project focuses on the translation of analysis data from Ecotect, into excel and forwardly into Rhinoceros, establishing a constant informational loop of data among these softwares, along site analysis(1), structure generation(2), informed panelization (3) and confirmation of values(4).
- The terrace of IaaC is analyzed in Ecotect according to the Barcelona Weather Data.
01. SITE ANALYSIS (1) - The Solar Access Analysis retrieves the information on more/less exposed areas along the terrace.
This data is exported through a .txt file from “Object Attribute Values”.
02. DATA TRANSLATION (1) - The information is brought into rhino after organizing the .txt file in Excel.
These values are controlled to correspond the mesh in Rhino ( that was previously exported into Ecotect).
03. MAX VALUES - Only the max range of values are preserved in order to generate the footprint of the structure.
04. FOOTPRINT - The geometry of the footprint is generated form the previous values.
This geometry is flat at this stage, only translating an occupation of the most exposed areas on the terrace.
05. GEOMETRY RELAXATION - The flat geometry is relaxed, generating a catenary surface that protects the most critical areas of the roof terrace.
06. SITE ANALYSIS (2) - The geometry is again imported to Ecotect.
The solar access analysis is again performed, this time over the generated structure.
The values are once again exported through the same process ( as in the site analysis).
07. DATA TRANSLATION (2) - The data is imported into the geometry, this time with a different purpose.
This will feed the generation of a pattern (circles) in each one of the panels.
08. FINAL STRUCTURE - The final structure is generated through a script that does a flat quads pannelization of the geometry, where each panel has a circular opening of radius invertionally proportionate to its own amount of exposure.


